
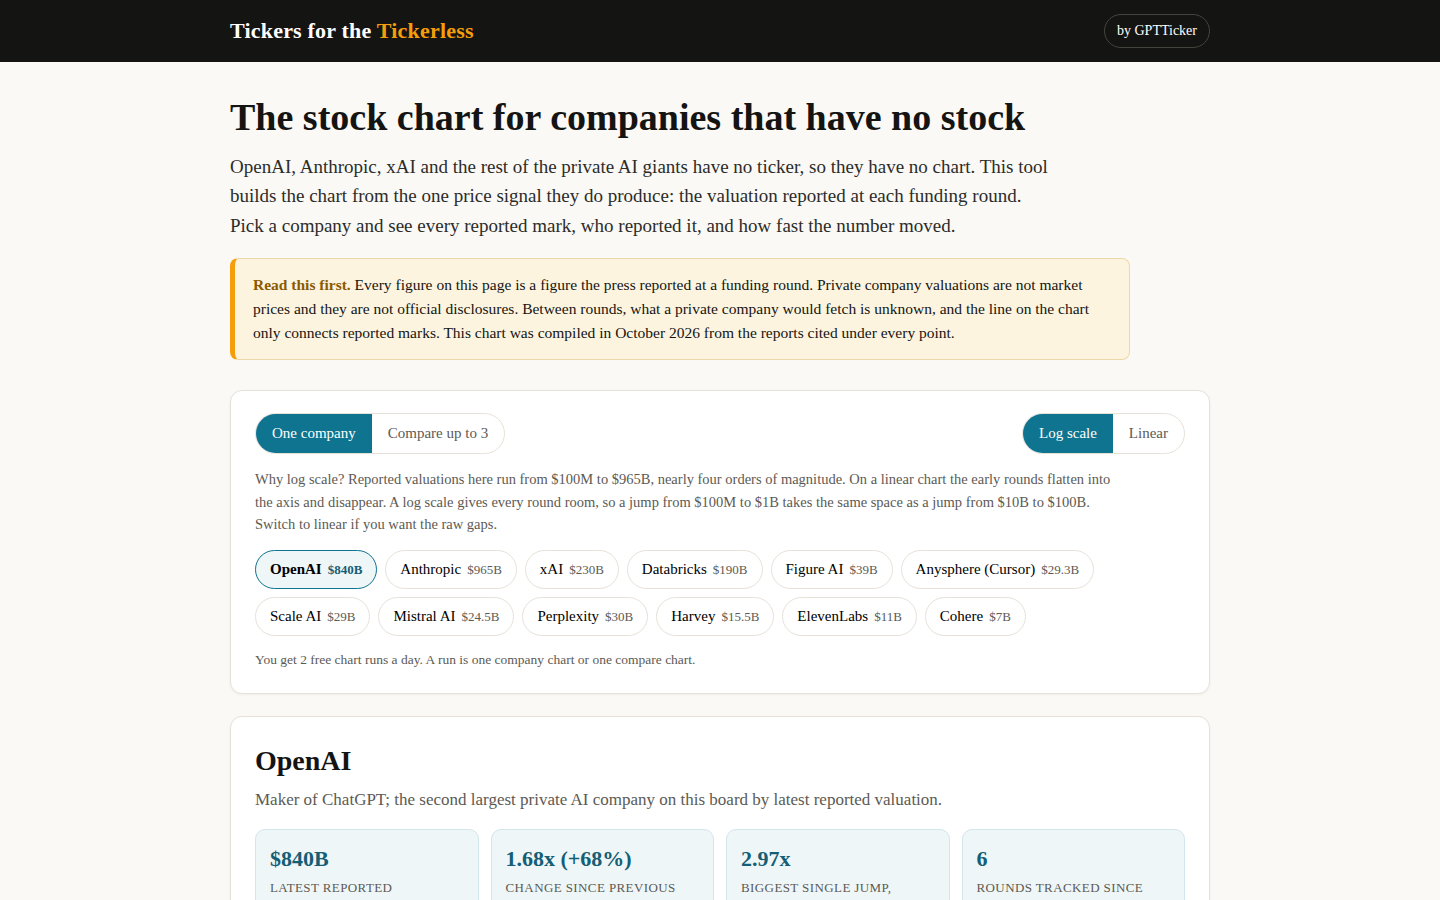
OpenAI, Anthropic, xAI and the rest of the private AI giants have no ticker, so they have no chart. Tickers for the Tickerless builds the chart anyway, from the one price signal private companies do produce: the valuation reported at each funding round.
Twelve companies are on the board, each chip showing its latest reported mark: Anthropic at $965B, OpenAI at $840B, xAI at $230B, Databricks at $190B, then Figure AI, Perplexity, Anysphere (Cursor), Scale AI, Mistral AI, Harvey, ElevenLabs and Cohere. Pick one and you get every reported round, who reported it, how fast the number moved, and, where the press has reported one, the revenue run rate plotted separately as diamonds, never mixed into the valuation line.
How a chart works
- Pick a company. One company mode shows its rounds table: date, round type, reported valuation, and the named source for every point.
- Choose your scale. Log scale is the default for a reason: reported marks here run from $100M to $965B, and on a linear chart the early rounds flatten into the axis.
- Read the round types. Primary rounds, tender offers, secondary sales and reported talks are drawn and labelled differently; talks marks are hollow, because a discussed round is not a closed one.
- Compare up to three. Overlay the paths of rivals and read the latest reported point for each, with its date and source.
The tool is blunt about what this is, and the bluntness is the feature: every figure is a press-reported round valuation, compiled in October 2026 from the reports cited under each point. These are not market prices and not official disclosures, and between rounds what a private company would fetch is unknown. Two chart runs a day are free; after that, an email unlocks the charts for the rest of the day. This site's usual beat is the public side of AI: the best AI ETFs and the hype versus revenue checks. The companion post reads the biggest chart line by line: OpenAI, $29B to $840B. Or open the Tickers for the Tickerless and pick your company.